Energy & Infrastructure
Energy infrastructure, supply and prices
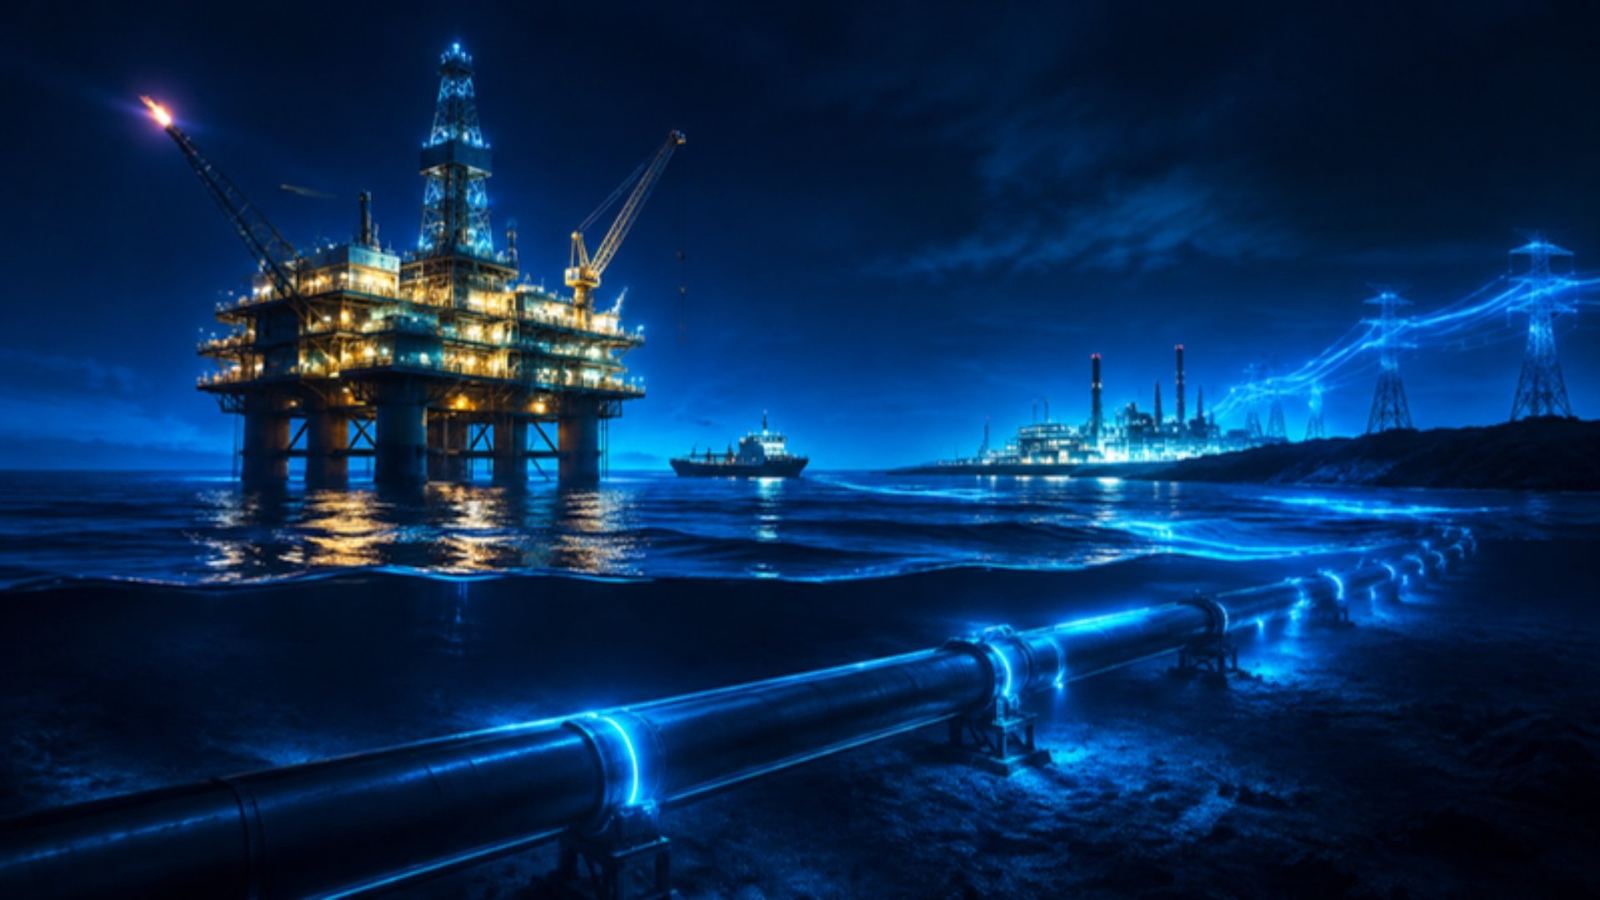
One map of the world's energy system: oil and gas fields, wells, pipelines, power plants and renewables, with the licences and companies behind them. Production, supply and price data sit next to the assets so you can see what moves the market.
For energy traders, infrastructure investors, insurers and policy teams.
Explore the free live demo for Norway
Live numbers
Counted from our live data.
Questions it answers
- Who holds the licence for this field, and who are the partners?
- Which pipelines, terminals and plants sit in a region at risk?
- How is production and supply trending in a country?
- Where are new wind, solar and hydro projects being built?
How teams use it
Supply risk
Overlay conflict, weather and outages on fields and pipelines to see which supply is exposed.
Counterparty checks
Trace licence partners and operators before signing a deal.
Transition tracking
Follow how renewable capacity grows country by country.
What you get
- Live map with the module's layers
- News & updates filtered to the subject
- Events & shows for the industry
- Reports you can download
Common questions
Does it cover offshore assets?
Yes. Offshore fields, wells, platforms and subsea lines are on the map alongside onshore assets.
How fresh is the data?
Live feeds such as positions, fires and alerts update every few minutes; registers and statistics update as soon as the official publisher releases a new edition. Every record shows when it was last updated.
Can I use it with my other modules?
Yes. Every module shares the same map, search and side sheet, so layers from all your modules sit together. Data from modules you do not subscribe to shows as a count with a link to add it.
Can I download what I see?
Reports can be downloaded from the Reports tab. Tables can be exported where the plan includes exports.